Notion Dashboard View: Build a Multi-Widget Overview
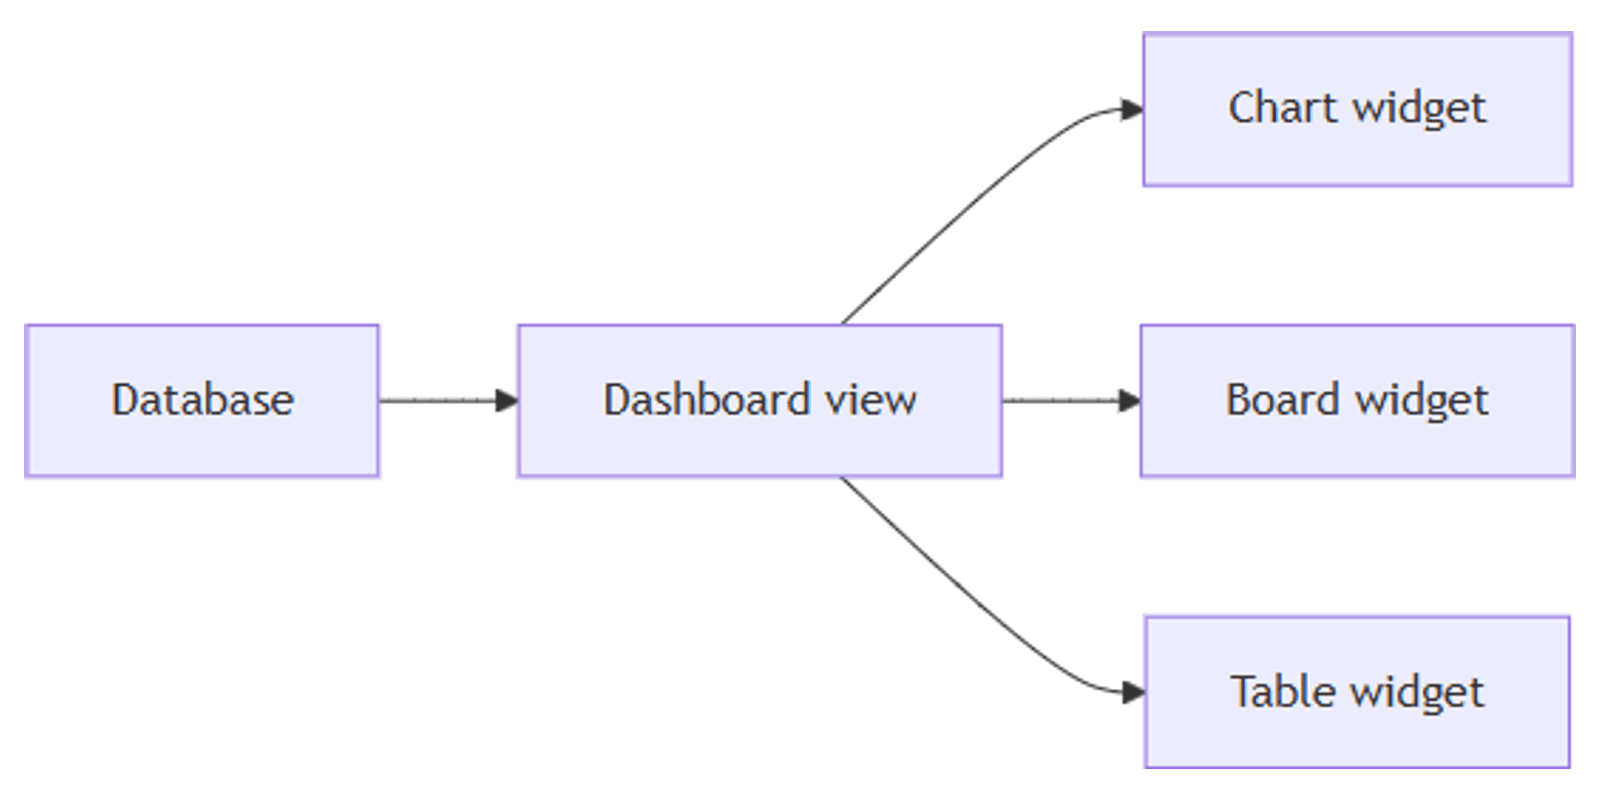
Notion dashboard view turns a database into an at-a-glance control center - charts, boards, tables, and timelines arranged as widgets in one layout. Instead of switching view tabs, your team sees the metrics and queues that matter on a single screen.
This guide covers how to create a Notion dashboard view, add widgets, use global filters, and choose when dashboards beat inline linked views. See Notion's dashboard documentation for official details.
What is dashboard view?
A Dashboard is a database view type. Each widget shows a database view (table, board, chart, calendar, timeline, list, and more). Widgets can pull from one database or multiple databases in your workspace.
| Dashboard view | Inline views on a page | |
|---|---|---|
| Layout | Stable grid of widgets | Freeform columns and blocks |
| Edit vs use | Edit mode vs View mode | Easy to accidentally break layout |
| Global filters | Yes - across widgets | Manual per linked view |
| Plans | Business and Enterprise | All plans |
Plan requirement: Dashboard views are available on Business and Enterprise only. On Free or Plus, build a similar page with linked databases and /chart blocks instead - see chart view and database views.
Limits: up to 12 widgets total and 4 widgets per row. Avoid stacking multiple dashboard views on one page for performance.
How to create a Notion dashboard view
Option 1: Add a view on a database
- Open a full-page or inline database.
- Click + Add a new view (or + next to view tabs).
- Select Dashboard.
- Notion opens Edit mode so you can design the layout immediately.
Option 2: Slash command
- On any page, type
/dash. - Select Dashboard view.
- Name the view and start editing widgets.
Option 3: Notion Agent
Ask Notion Agent to draft a dashboard - e.g. "Create a dashboard for my Tasks database with open tasks by status and overdue items." Then switch to Edit mode to rearrange widgets.
Build your dashboard
Add and arrange widgets
- Enter Edit mode (button in the database header).
- Click + on a row or at the bottom to add a widget.
- Choose an existing view or create a new one for that widget.
- Drag widgets between rows; drag handles between widgets to resize widths.
- Drag row dividers to change heights.
Right-click a widget (or click its title) to Duplicate or Delete it.
Configure what each widget shows
From a widget's view options, set:
- Filters - e.g. Status is not Done
- Sorts - e.g. Due date ascending
- Groups - e.g. by Assignee
- Visualization - table, board, chart, calendar, timeline, list
Note: filters and sorts applied in View mode are local unless you choose Save for everybody (requires edit permissions). Changes to an underlying view may also appear wherever that view is used.
Global filters
Global filters apply across multiple widgets at once - even when widgets use different databases.
- Click the filter icon on the dashboard.
- Choose Filter multiple sources.
- Pick a property and set criteria (e.g. People Assignee contains Me).
Rules:
- A global filter only affects widgets whose views include that property.
- You can add multiple global filters on one dashboard.
- Widget-level filters still apply on top of global filters.
This is the main advantage over a page of manual linked views - one control updates the whole board.
View mode vs Edit mode
| Mode | Use when | You can |
|---|---|---|
| View | Day-to-day use | Open pages, use visible filters/sorts, edit items per permissions |
| Edit | Designing the layout | Add/remove/rearrange widgets, change row heights, swap views |
Keep most teammates in View mode so the layout stays stable.
Practical layout examples
Team status hub
- Row 1: Chart - tasks by Status.
- Row 2: Board of active work + table of blocked items.
- Row 3: Calendar of due dates this week.
Content calendar overview
- Row 1: Number chart - posts published this month; donut by Multi-select Platforms.
- Row 2: Board filtered to Status is In review.
- Row 3: Calendar by Publish date.
Works with the Social Media Multi-Platform Content Planner.
Sales / CRM pipeline
- Row 1: Chart of deals by stage; number chart for total pipeline value.
- Row 2: Table of deals where People Owner contains Me.
- Row 3: Timeline of close dates.
Pair with the CRM Dashboard template.
Ticket / support triage
- Row 1: Charts - open tickets by severity and by channel.
- Row 2: Table of unassigned tickets; table of SLA-risk items.
- Global filter: Severity is Critical when incidents spike.
Dashboard vs page of charts
| Goal | Better choice |
|---|---|
| Stable reusable overview on Business+ | Dashboard view |
| Freeform page with text, images, callouts | Inline linked views + columns |
| One or two charts on Free/Plus | /chart blocks (chart view) |
| Global filter across sources | Dashboard |
Performance tips
- Filter each widget to the smallest useful set (this week, not Done, my items).
- Prefer charts and short lists over huge unfiltered tables.
- Stay under 12 widgets; avoid multiple dashboards on one page.
- Use widgets as entry points - drill into rows for detail instead of showing everything.
Permissions and troubleshooting
Who can create or edit dashboards: members with edit access to the database. View-only users can open the dashboard in View mode and interact based on their permissions.
Common issues:
- Dashboard option missing - requires Business or Enterprise.
- Global filter does nothing on a widget - that widget's view must include the filtered property.
- Layout changes keep disappearing - you may be in View mode; switch to Edit to rearrange widgets. Save filters for everybody when needed.
- Dashboard feels slow - reduce widgets, tighten filters, replace large tables with charts.
FAQ
Are Notion dashboard views free?
No. Dashboard views require Business or Enterprise. Free and Plus users can approximate layouts with linked databases and chart blocks.
How many widgets can a Notion dashboard have?
Up to 12 widgets total, with a maximum of 4 widgets per row.
What is the difference between View mode and Edit mode?
View is for using the dashboard day to day. Edit is for adding, removing, and rearranging widgets.
Conclusion
Notion dashboard view packs charts, boards, and tables into one reusable control center - create a Dashboard view, add up to 12 widgets, use global filters, and keep design work in Edit mode. Pair with chart view for KPIs, filtering for focus, and People for ownership slices.
For all view types including board, timeline, and form, see Notion database views.
Notion Templates
Start Selling Notion Templates - Start Now!